Power BI
Overview
Power BI is a personal Business Intelligence software. It allows you to aggregate data from multiple sources, analyze it, and then create visuals to tell a story.
The Power BI lifecycle includes:
- Data discovery/shaping: Bringing data from other sources into Power BI, and making sure it is correctly formatted
- Data modeling: Connecting data from different sources and using DAX functions to create relationships
- Data visualization: Creating graphs, charts, maps, etc., for a visual representation of data
Power BI includes a desktop application that must be installed and a web-based application that requires signing in with your KU Online ID and password. Both applications are required for full capabilities. The desktop application is only available on the Windows operating system; if you use a Mac, please contact your Technology Support Center staff for assistance.
Access Power BI
Power BI includes a desktop application that must be installed and a web-based application that requires signing in with your KU Online ID and password. Both applications are required for full capabilities. The desktop application is only available on the Windows operating system; if you use a Mac, please contact your Technology Support Center staff for assistance.
Install the Desktop App
(Windows operating system required)
- Type software center into your search bar / start menu in the lower left corner of your home screen.
- Select the Software Center App to open it.
- Select the Microsoft Power BI Desktop app.
- Select Install.
Access the Online Power BI Service
- Go to Microsoft 365 landing page and log-in using your user ID an password.
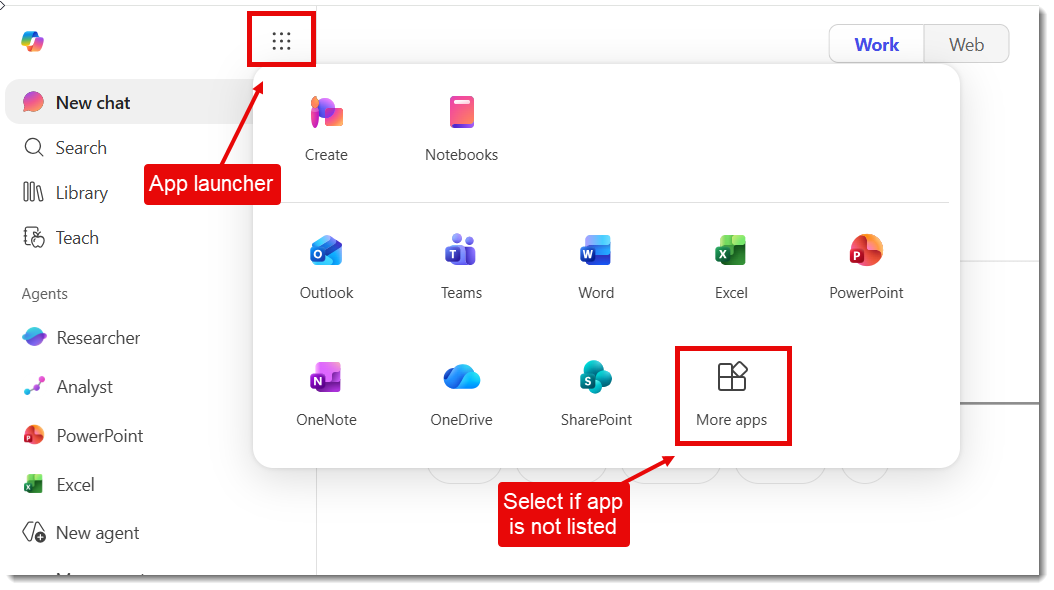
- Select the App launcher "waffle" icon from the top of the left menu, then select More Apps at the bottom right of the window.
View ScreenshotSelect All apps at bottom right area of window.Waffle icon is the 9 dot icon in the blue bar. - Select the Power BI app.
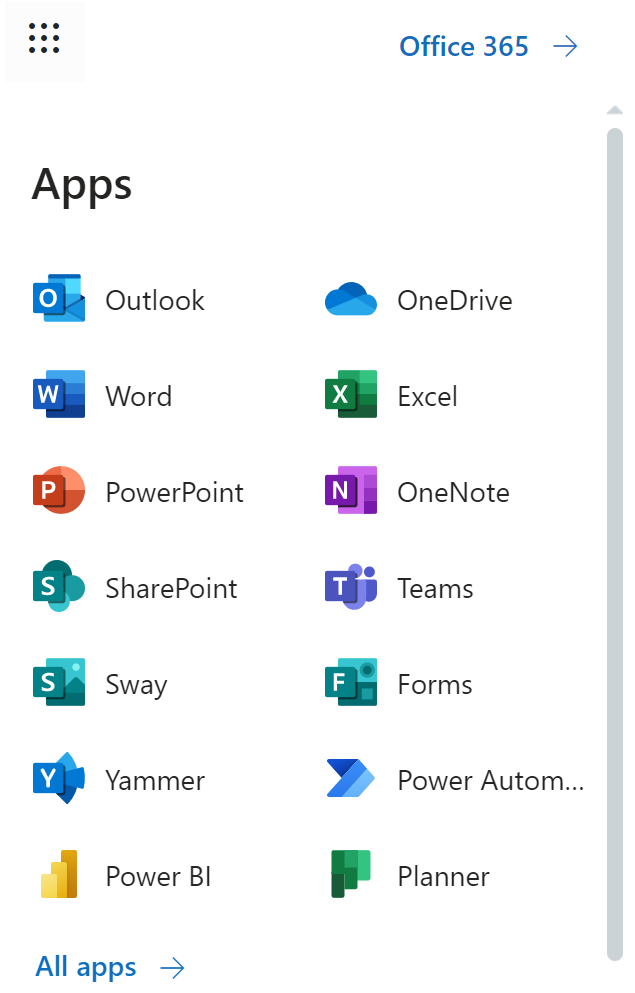
- If this app is not in the list on the left side, choose All apps and enter Power BI in the search bar.
View ScreenshotAll apps located at the bottom-left of screen
Load Data
Power BI can load data from many sources such as Excel, SharePoint, Access, and SQL.
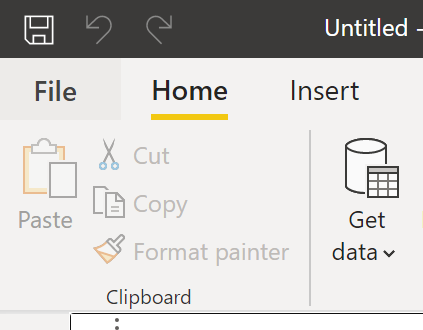
- Select Get data from the Home ribbon.
View ScreenshotSelect the Get Data link from the ribbon. - Choose your source from the list and select Connect.
- Browse to the location of the data you want to load and select Open.
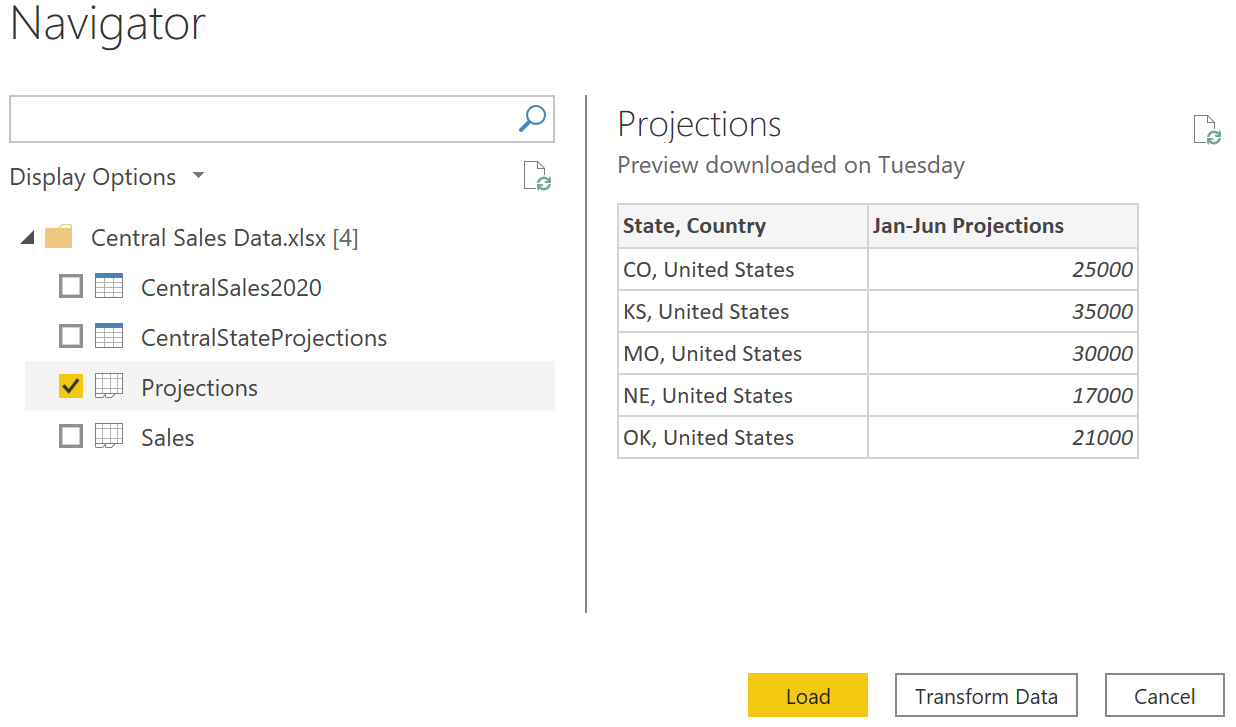
- Once the Navigator opens, select the specific data you want to load and then choose to Load or Transform Data.
View ScreenshotSelect data source from the left panel.- Choose Load if your data has already been transformed and normalized so that it is ready for analysis.
- Choose Transform Data if you need to make modifications so that it can be analyzed. Go to Transform Data below for more information.
Transform Data
If your dataset needs to be edited before it can be analyzed, choose to Transform Data when you are loading your data.
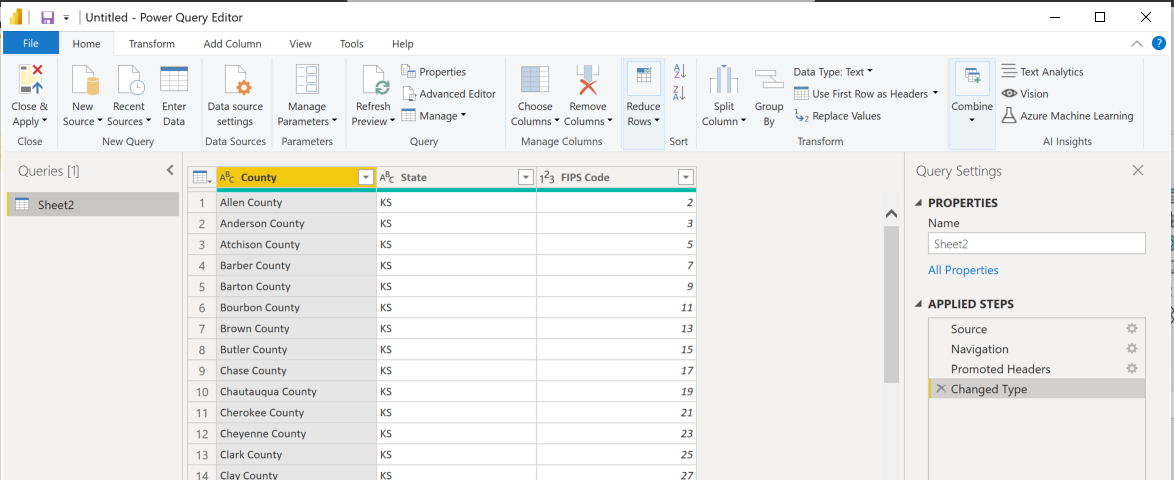
Choosing to Transform Data will open the Power Query Editor which allows you to complete many steps that will normalize your data so it is ready for analysis.
View ScreenshotPower Query Editor.
Here are some examples of data transforming:
- Reduce data down to smallest meaningful value (ex: columns with first and last names should be split into separate columns)
- Remove unnecessary data (ex: columns of information you know you don't need for your analysis)
- Standardize data (ex: characters like $ or extra spaces will interfere with analysis)
- Reconcile data types (ex: columns that contain dates should be formatted as a date type)
After finishing the data transformation process, choose Close & Apply in the upper left corner. This will apply your changes to the dataset and close the Power Query Editor.
Create Reports
Create a Visual
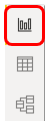
- Choose Report mode from the left menu.
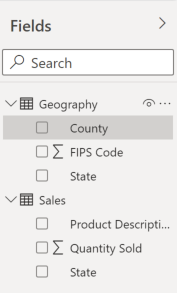
View ScreenshotReport mode icon from the left menu. - Your datasets will be listed in the Fields pane on the right side.
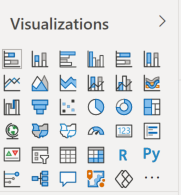
View ScreenshotFields pane on the right side. - From the Visualizations pane, choose the visual you'd like to create; for example, a column chart, pie chart, etc.
View ScreenshotVisualizations pane. - In the Fields pane, select the box next to the fields you want to include in your visual.
- Repeat this process to create multiple visualizations and build your report. Use the + button at the bottom of the page screen to add pages to your report as needed.
Format the Visual
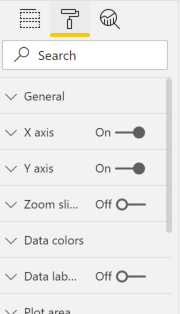
- With the visual selected, choose Format from the Visualizations pane (the paint roller).
View ScreenshotChoose the paint roller icon to Format. - Options listed under Format are dependent upon the type of visual you have created, but in general, you can change things like the title of the visual, colors, and data headings. You can also add a border or a shadow outline around your visual.
Publish the Report
After creating your report, you will need to publish it to your online Power BI Service so that it can be shared with others.
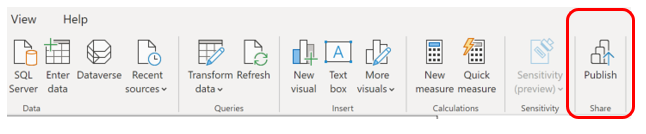
- Select the Publish button from the home ribbon.
View ScreenshotPublish icon far-right in ribbon. - Select My workspace as the destination.
- Click the link to open your report in Power BI.
- Once the report opens in the online Power BI Service, you can choose to share the report and/or build a dashboard. Find more information about sharing reports and building dashboards using the left navigation.
Share Reports
You can share your report with others in several ways. If your intended recipient has a Power BI Pro account (all KU faculty and staff do), you can share your report directly through Power BI. You can also share your findings by exporting to a PDF or PowerPoint, embedding in a website, or adding to a Microsoft Team.
Share Through Power BI
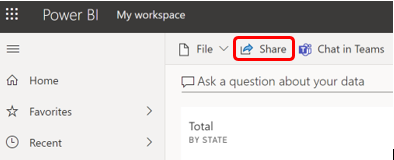
- Select Share from the top menu.
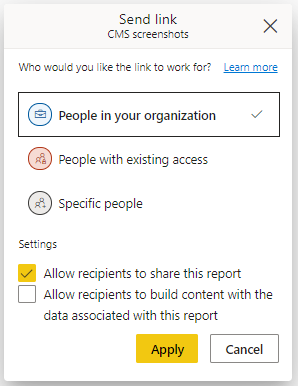
View ScreenshotShare button in the ribbon. - Select to whom you want to send the link and choose permission settings.
View ScreenshotDesignate who can open the file.
Export to Another Program
- Select Export from the top menu.
- Choose to export to PowerPoint, PDF, or Analyze in Excel (which will require installing extra features in Excel).
View ScreenshotExport option in top menu.
Exporting to PowerPoint creates a connection between PowerPoint and Power BI so that when you use a visual from your report in a PowerPoint presentation, clicking on the visual will take you to the full Power BI report.
Exporting to PDF creates a static document of your visuals.
Share Through Microsoft Teams
- Select Chat in Teams from the top menu.
View ScreenshotChat in Teams option in top menu. - Choose to Share to a channel or Create an Assignment.
- Search for the appropriate Team/Channel.
- Click Share.
Note: Before you can add a report to a Team:
- The Teams tab must have Power BI enabled.
- Team members must have permission through Power BI to view the report. (see "Share through Power BI" above)
Dashboards
After publishing your report to the online Power BI Service, you can build a dashboard to share with others. The dashboard is a single page of visualizations that have been carefully curated to present a summary of analysis. You can also share the full report with others from the Power BI Service. Find more information about Sharing reports in the left navigation.
Build a Dashboard
A Power BI dashboard is a single page that uses visualizations to tell a story. Clicking on a visual takes you to the full report that was used to create it; one dashboard can contain visuals from multiple reports and datasets.
- Open your report from your workspace.
- Hover on a visual that you want to pin to your dashboard.
- Select the pushpin that appears in the icon menu.
View ScreenshotPin icon.
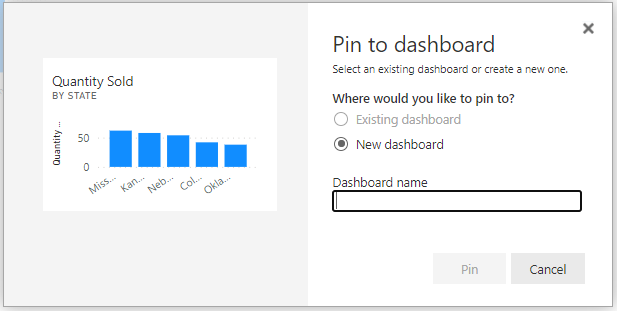
If you don't see the pin, you made need to move your visual around. - When the Pin to dashboard window opens, choose to pin your visual to a New dashboard and name your dashboard.
View ScreenshotSelect button next to New dashboard, then name your Dashboard in field. - Repeat this process until you have built your dashboard.
Share Your Dashboard
- Choose Share from the ribbon at the top.
View ScreenshotShare button in the ribbon. - In the Share dashboard window, enter the email address of the person with whom you'd like to share your dashboard. Include a message, and select permissions, as appropriate.
View ScreenshotShare dashboard window.
Use Someone Else's Dashboard
Watch Power BI Dashboard (video) for instructions on how to use a dashboard that's been shared with you.
Refresh Reports
Most reports will use data that is periodically updated, which requires that the report be updated as well. You can set your report to refresh, pulling in the new data from your original data sources and updating your reports and dashboards.
The refresh process is much simpler when your data is saved in the cloud (such as on a SharePoint, Teams, or OneDrive for Business site) than if it is saved on premises (such as in your department's drive on the KU network). When data is saved on premises, Power BI needs a "gateway" to be able to connect to the data.
Data Refresh in the Cloud
- After creating your report, make sure it has been published to the Power BI online service. Navigate to Create Reports in left navigation for more information.
- After your original data source has been updated, log in to the online Power BI Service.
- Select the workspace where your project is saved.
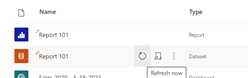
- Hover on the project's Dataset and select the Refresh now icon.
View ScreenshotWaffle icon is the 9 dot icon in the blue bar. - Under the Refreshed column, a spinning circle will appear to indicate Power BI is processing your request, and the date/time stamp under the Refreshed column will update to the current date/time once the request is finished.
- Select your Report.
- Select the Refresh icon in the upper right corner of the report.
Data Refresh On-Prem
- After creating your report, make sure it has been published to the Power BI online service. Navigate to Create reports in left navigation for more information.
- Contact your Technology Support Center staff for assistance in installing a gateway on your computer. This gateway will need to be connected to all of your original data sources so that Power BI can access them.
- Follow the steps listed above for Data saved in the cloud.
Schedule Automatic Refresh
- Find the workspace where your project is saved in the Power BI online service.
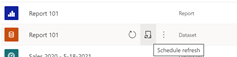
- Hover on the project's Dataset and select the Schedule refresh icon.
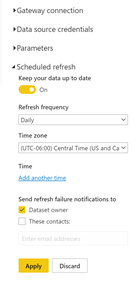
View ScreenshotSelect the refresh icon to the right of project dataset name. - Expand the item called Scheduled refresh.
- Toggle the switch from Off to On.
View ScreenshotSelect toggle to switch Off to On. - Select your refresh frequency and other details and choose Apply.
Data Modeling
Data modeling in Power BI has 2 components:
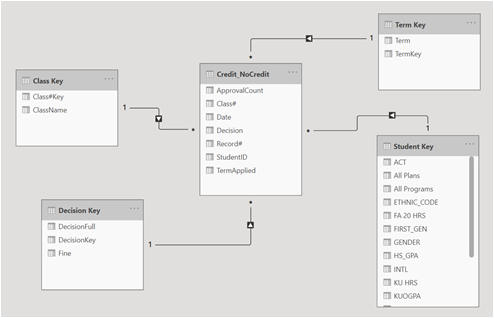
- Creating relationships between datasets.
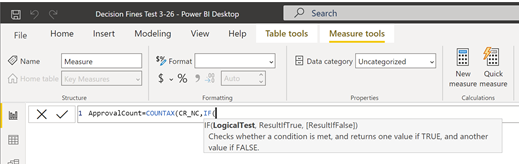
View ScreenshotExample of relational tables. - Writing calculations using the DAX (Data Analysis Expressions) formula.
View ScreenshotExample of calculations using DAX.
Workshop Recordings
We are currently hiring for the position that will teach the Power BI classes. We plan to offer these courses again once the position has been hired and up-to-date. In the meantime, find recordings of the Power BI workshops here.
Power BI Essentials II (video)
Class Materials: